Climate model graphics
Canadian Centre for Climate Modelling and Analysis
Canadian Global Circulation Model 3
Diagnostic plots
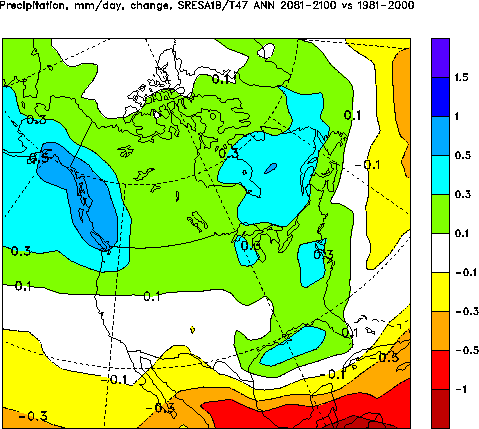
 Figure 1. Units: mm/day
Projected change in annual mean precipitation rate in 2081-2100 relative to 1981-2000 as simulated by CGCM3/T47 in the IPCC SRES A1B experiment (5-member ensemble mean)
 Figure 2. Units: %
Projected change in annual mean precipitation rate in 2081-2100 relative to 1981-2000 as simulated by CGCM3/T47 in the IPCC SRES A1B experiment (5-member ensemble mean)